Tuesday, December 6, 2011

So you think you can classify?

One of my favorite ways to teach is through error and frustration.  Maybe that sounds mean, but one of the most "a-ha" activities that we do every year results in just that - mistakes, failure and frustration.

Before teaching our unit on Classification of Living Things, I decided a few years ago not to tell the kids what we would be learning next, but to just give an activity with easy-to-follow directions, but no guidance about why we were doing it.

I created a few identical decks of cards with pictures of forty-some animals on them.  Each group gets a deck of cards and is given the task to dividing the animals into two groups based on their characteristics.  Then, each of the two groups must be divided again into two groups.  They record their results on a sheet like this:


What the students do not realize, however, is that the groupings they create and the records that they keep are not really the goal of the assignment - it's the discussions that arise during the activity.  Inevitably, every system that the students devise during this process becomes a horrible failure.  Some students opt for the first two categories to be land and sea, but cannot decide about the frogs.  Some opt for big and small, but then struggle with the medium sized animals.  Some opt for furry and not furry, but struggle with classifying the birds and whales.

In the end, we have a whole-class discussion about some of the problems involved in their classification schemes.  Every year that we have done this activity, the students have drawn the same conclusions about the difficulty of classifying organisms - which characteristics are important and really show evolutionary relationships, and which ones are not.

Even though our textbook surprisingly does not describe the relationship between evolutionary relationships and common ancestors to classification, the students begin to make these connections during our conversation.  We just finished learning about evolution, natural selection and common ancestors, so the tie-in fits perfectly.

Naomi's Book of Lists

As anyone who has read our beloved sixth grade novel Becoming Naomi Leon by Pam Munoz Ryan knows, Naomi is good at three things: "1.) soap carving, 2.) worrying, and 3.) making lists."  As an activity for the length of the novel, we created our own "Books of Lists." 

Each student was provided with a notebook to create lists about the book, both from Naomi's perspective and their own.  Some lists were inspired by lists from the book, while other lists were created for students to reflect on the book. 

Because their homework and journaling assignments are so writing intensive and because writing is so effortful for many of our students, many found it refreshing to be able to write lists in phrase form, or simply jot down words.  They liked having at least one outlet for writing that wasn't checked for mechanics or written in complete sentences; one to simply reflect without the burden of the writing process. 

Below are some images of our books:


Monday, December 5, 2011

Blogging about Glogging

Our school recently subscribed to an online service called Glogster EDU.  This is the education institutional version of the popular Glogster.  In Glogster, you can create posters with text boxes, graphics, images, videos and sound bites to be viewed either within your institution or publically to all Glogster EDU schools.  The software has hundreds of preloaded images and sounds, or you can "grab" videos, sounds and images from the web, your files or your webcam. 

I am new to glogging, so I allowed the kids to experiment with software by assigning a project with very loose parameters.  We are currently reading Pam Munoz Ryan's Becoming Naomi Leon, one of our favorite sixth grade novels.  The main character, Naomi, is known for being shy and quiet and expressing her ideas mostly as lists in her notebook.  Each student created a glog that captured this aspect of Naomi's character, but with a little more visual flair.  They created a poster that included images, text boxes, videos and the like as a virtual scrapbook of her experiences in the novel. 

Each student had a different interpretation of the assignment.  Some chose to make lists like Naomi, while others chose to feature primarily images.  Some wrote diary entries in the text boxes, while others took the "scrapbook" direction more literally and compiled artifacts and pictures with captions.  Overall, there was a wide range of ideas that came from the project. 

My ultimate goal was to try the software and see if the students had anything unique discoveries or ideas with it.  Later on, I can refine my idea of what I would like them to produce and give them more workable parameters for the assignment.  They will also have more practice with how to use and navigate the software for future work. 

Wednesday, November 16, 2011

Natural Selection Monsters

Even though natural selection is one of the most important concepts covered in sixth grade, it is one of the hardest for the kids to conceptualize and understand.   After we read and instruct about the process, we model the process in action by creating fictional monsters with favorable and unfavorable traits and playing a game to see how they fare at survival.

To create the monsters, we used Me Make Monster, a website that allows you to customize and name a monster, then purchase gifts with the image printed on them.  Students are placed into partner groups to experiment with the website and create two monsters, a male and a female, that are mostly similar with some favorable and unfavorable variations. 

Some of the students' monster creations are shown below:

The images of the monsters are printed, then placed on a family tree-style diagram poster.  The students fill in a chart explaining the various traits of the two parents and determining whether the traits are favorable or unfavorable.  The family tree poster is shown below:


Once the two parent monsters have been created and defined, the students roll a die to determine the traits of the offspring.  For each trait, for example, hair type, the students will roll the die to determine if the individual offspring will get the mother's trait by rolling an even number or the father's trait by rolling an odd number.  As this process is repeated, the parents should produce four unique offspring.

For each offspring, the students then analyzed their traits and determined how many were favorable and unfavorable.  They then followed the directions for a new game using the die again that would decide the fate of each individual - survival or death.  The more favorable traits an individual had, the more likely it was to survive in the game. 

One of the main points that we tried to deliver when discussing natural selection is that it is more about tendencies and likelihood than it is about guarantees, and that is why evolution is such a slow process.  In the game, as in life, it is possible for a very well-suited organism not to survive, just as a very unsuited organism can survive. 

Friday, October 28, 2011

Fossil Records

We have moved on from plate tectonics, earthquakes and volcanoes and it is now time to move on to Life Over Time.  Over the next few weeks, we will explore how life developed on Earth, how it changed over time, and the theory of natural selection.  The very first section covers fossil evidence of earlier species.

There are three basic types of fossils that can be discovered:  parts of an organism, whole preserved organisms, or traces, molds and casts of organisms.  It is much more rare to uncover a whole organism or a part of an organism.  To demonstrate this point, we made a fossil record of our own lives and played a little guessing game to determine whose fossils we studied. 


It is worth noting that we took a few liberties here with our interpretation of "fossils."  The students selected five small objects that represented different stages in their lives - baby, toddler, early childhood, upper elementary grades, and middle school.  We made sure to discuss, however, that fossils are remains of living organisms, not objects.  Either way, students made fossils from air-dry clay of their objects then "buried" them in order of when they occurred.  The oldest fossils would be found below the newer ones.

Because I teach three sections of sixth grade science, it was easy to scramble up the samples the following day.  Each student in the class received the fossil record of another student in another homeroom.  They filled in a chart with their best hypotheses about what the imprints showed, what they represented and what they were able to learn about the person.  Finally, they made a guess about who they thought the created that record.  We revealed the guesses and made it into a fun game at the end of the second day of the lab.  

Wednesday, October 12, 2011

Explosive Volcanoes!

We are all familiar with the baking soda and vinegar model of a volcano, but only a science teacher would fixate on how little this instructs about how a volcano actually works.  Sure, it looks cool, but volcanoes really have nothing to do with some kind of substance pouring down, creating a chemical reaction and fizzing out of the top. 

Instead, we decided to model volcanoes in a more accurate, albeit messier way.  When we studied volcanoes, we focused primarily on the types of sites where volcanoes occur (convergent plate boundaries, divergent plate boundaries and above hot spots), as well as the basic parts of a volcano.  The magma/lava, afterall, comes from below the surface and as it cools on Earth's surface, new rock is created, not just a fizzy mess of baking soda and vinegar. 

Our volcanoes were constructed out of clay.  We constructed the mounds around a straw that had been poked through a paper plate and secured in place on both sides with rubber bands.  The paper plate will represent Earth's surface, the clay represents the volcano mound and the straw will become the main pipe of this cinder cone-like volcano.  Make sure that several inches of straw are exposed on the top of the plate and at least one inch below the plate.  We constructed the volcano/straw structure on the first day of the lab, then let them dry over the weekend.


When we returned on Monday, the eruptions could begin.  We created our own mock magma the same way we had for our seafloor spreading demonstration - white school glue mixed with red and yellow food dye.  Carefully using a funnel, we filled a balloon with the magma, thus representing the magma chamber below the surface.  Make sure not to overfill the balloon or it will be impossible to attach to the model.  Only fill the round part of the balloon, not the neck. 

We washed the funnels out right away to make sure that the glue did not dry, creating a permanently glued mess.  Once the funnels were washed and the balloons filled, we carefully rubber-banded the balloons to the exposed inch of straw under the plate.  It is nearly impossible to make the rubber band tight enough by wrapping it around, so I suggest using a slip or loop knot tightly around the straw.

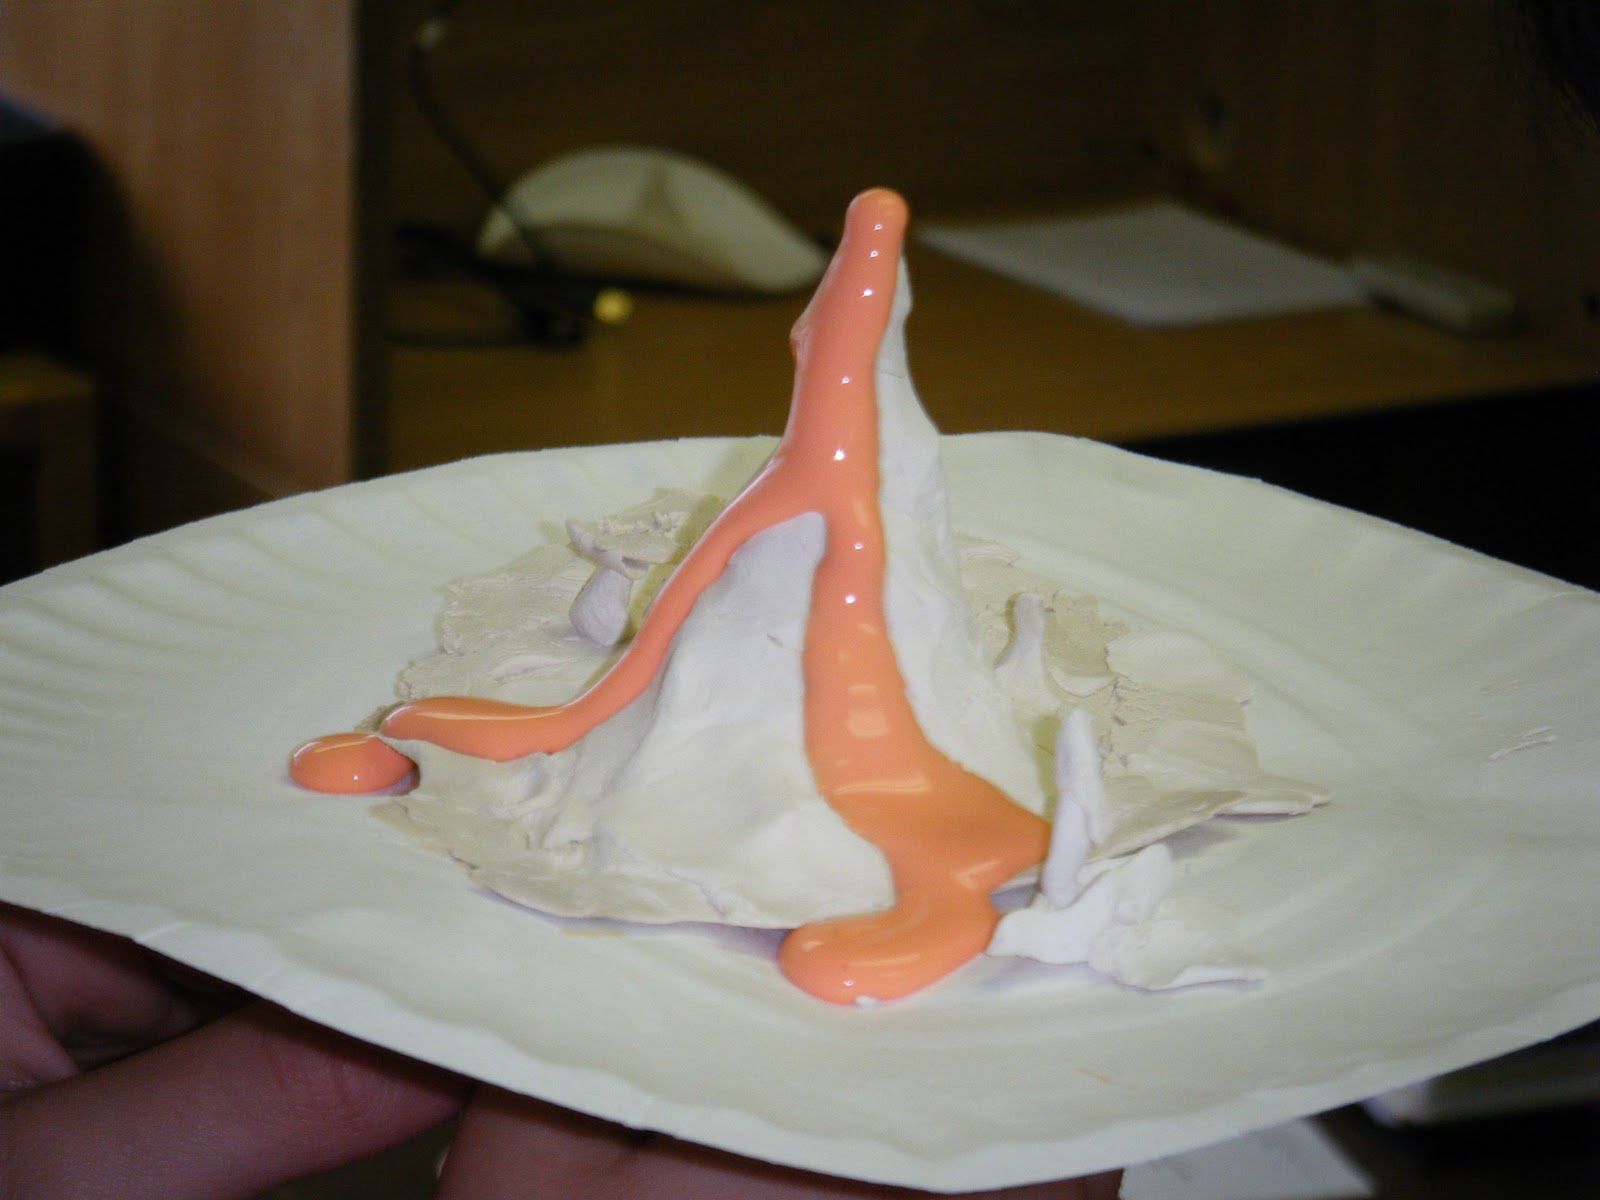
One partner should hold the knotted rubber band and the base of the balloon around the straw while the other partner gently pumps the balloon.  The magma should flow freely out of the straw.  On their lab sheets, I asked students to reflect on where and how the lava flowed depending on the slope and roughness of the mound's surface.  They also noted that as the lava "cooled" (really it was drying), it slowed down in its flow and began to pool up in low-lying areas. 


Whenever setting these models down, we always placed them on two desks with the bottom's balloon and exposed straw poking in between the crack of the desks.  In order for the models to dry overnight, we make stacks of textbooks with cracks in between so that they could sit flat to dry.  Once all of the glue was dry, I cut the balloons and excess straw off the bottom with scissors so that the models could now sit flat for further analysis for their lab sheets. 


This was a fun way to model how volcanoes work that was a little more accurate than the old vinegar and baking soda model.  While there were plenty of opportunities for huge messes during this lab, most students genuinely wanted their model to be successful and carefully followed the directions to do so.  Once students analyzed the eruption, filled in their sheets identifying each part of the model and what it represented, and read the accompanying text, I felt that they had a far better understanding of a volcano than from the baking soda model.

Wednesday, October 5, 2011

Modeling a Seismograph

While reading through our text and completing our notes, we read about how seismographs measure the intensity of earthquakes, but there is no better way to explain it than to see one in action.

Last year, I came across a deeply-discounted model of a seismograph in one of the science supply catalogs, so we bought it.  The model is a very basic one, just a roll of paper with a stand and a mounted felt-tip pen that moves freely in response to movement. 

In class, we used styrofoam blocks cut at an angle to represent tectonic plates meeting at a fault.  We sat down around a wobbly table and created some quakes with our "plates."  Luckily for us, our classroom table is already pretty wobbly, so it didn't need much help!

We modeled earthquakes at three types of faults - normal faults, reverse faults and strike-slip faults.  The seismograph measured the intensity of each. 

Below are some images of our "quakes" in action:


Even though our styrofoam blocks made quite a mess of foam dust, it was worth it to see the students really understand how seismographs work and to let them take a break from normal classroom routines and shake things up a little!

Wednesday, September 28, 2011

A Teachable Earthquake

When something unexpected occurs, either in the classroom or in the world, and it provides an opportunity to teach outside of the curriculum, educators refer to this as a "teachable moment."  The East Coast Earthquake of 2011, centered in Virginia, is an example of a "teachable" event that actually fits conveniently into our curriculum for sixth grade.

After our study of plate tectonics, we have moved on to look more closely at the catastrophic byproducts of plate movement - earthquakes and volcanoes.  As we studied earthquakes, however, the earthquake that we all experienced just a few weeks ago has become a meaningful piece of experience that the kids all share with the concepts covered in class.


Once we had explained the causes of earthquakes, as well as the concepts of the focus and epicenters of quakes, we were able to examine the USGS maps of the 2011 East Coast Earthquake.  Since several of our students were on vacation in several different spots along the east coast, we were able to plot their locations and their experience based on the epicenter and magnitude diagram shown below. 


Most of our students knew several facts and had lots of questions about the earthquake based on the news coverage from that day.  To further explore their memory of the quake, we watched news footage of the breaking story.  The video below includes security camera footage of the shaking at the White House. 


Overall, the kids could much more easily relate to the feeling of a quake given that they had just experienced a historic one just a few weeks ago.  

Tuesday, September 20, 2011

Convection Currents

So far, we have examined Earth's plates and how they move, as well as what occurs at convergent, divergent and transform boundaries.  But why are the plates moving?

Tectonic plates are floating above a plastic-like layer of magma material in the mantle.  The intense heat in this layer causes convection currents.  Convection currents are circular patterns of heat in liquids and gases.  Generally, hotter material is less dense and cooler material is more dense.  As material nearest to the outer core is heated, it becomes less dense and moves upward above the cooler material above.  As it moves closer to the crust, however, it cools, becomes more dense and begins to sink again, creating a circular current of heat movement.  Depending on the direction of these currents, the plates slowly move together, apart, or past each other. 

The phenomenon is visible in heated water, as well.  It happens much more quickly, of course, but it makes for a good demonstration in class. 

For this lab, we place beakers of water onto a lab burner.  I usually place a few beakers on each burner so that the demonstration can be attempted a different temperatures or multiple times.  As the water heats, students answer discussion questions on their lab sheet including, "which part of the beaker is the hottest?" and "which part of the mantle is hottest?"

As the water heats, add a drop or two of food dye into the water.  The students must watch closely because the dye will become completely mixed into the water very quickly, especially if the water is already very hot.  On their lab sheets, they should draw as accurate of a sketch as possible to show the circular currents of food dye in the water.  Once the dye becomes completely mixed, the convection currents are still occurring, it is just no longer visible. 

Below are some images of the circular currents in action:


Friday, September 16, 2011

Spreading the Word about Seafloor Spreading

Inevitably, as soon as we finish explaining how the continents could have drifted apart, the questions start rolling in about how this could have happened.  Luckily, the next section in our notes and our next "lab" answers just that question!

The process of seafloor spreading is what causes the continents to slowly drift apart.  Running down the middle of the ocean is a mid-ocean ridge - a crack between two tectonic plates.  At the mid-ocean ridge, the fiery hot convection currents of magma below the crust exert intense pressure and push the two plates slightly apart.  The magma oozes into the crack that is created and creates new seafloor and the ocean becomes gradually wider, forcing the two continents apart. 

On the opposite end of the plate, the pressure collides the plate with another plate.  Generally, these plates converge and one dips below the other.  As it delves deeper into the mantle, it is heated and melts back into magma, thus continuing the cycle.

In order to model this phenomenon, we created a simple model out of construction paper, glue and masking tape.  I prepared ahead of time by cutting out brown construction paper to model the tectonic plates.  I cut 9" x 12" paper into 4" x 4" squares.  Each group will need four of these squares.  For each group, take two of the squares and tape them together with masking tape end to end.  The other two will stay separate. 

We created mock magma by combining white school glue with red and yellow food dye and mixing it with a popsicle stick in a small paper cup.  The students then spread the magma in a thick stripe down the middle of the large sheet of white paper.  We placed the taped together plates and the loose plates over the strip of magma touching end to end with the intersection over the strip.  At the far ends of the brown paper, we taped them loosely to the white sheet just to hold them in place.  Finally, we were ready to model the process. 

The students slowly slide the plates apart over the magma and watch as the magma rushes in to fill the crack.  As the magma cools, new seafloor is formed and the ocean is wider.  On the other side of the plates, they meet another plate and the intersection either rises like a ridge or mountain range, or it dips below another plate.  Both of these possible outcomes are shown on the model. 

I provided the students with a sheet of labels to apply to their diagram.  They simply cut out the labels and applied them where they belong.  Below are some images of the works in progress, and a completed sample:


Thursday, September 15, 2011

Piecing Pangaea

Each year, the first order of business in sixth grade science is to cover plate tectonics.  This is one of the most difficult and abstract concepts that we cover all year, and it falls in the very first two weeks of their middle school transition. 

In order to demonstrate how scientists were able to piece together Pangaea, we begin by examining the current map of the world.  The earliest conjecture about the existence of a 200+ million-year-old subcontinent was probably German meteorologist Alfred Wegener, and his first clue was the puzzle-like fit of the continents together.

As a quick activity after students have read and taken notes about continental drift, they cut a map into continent puzzle pieces and explore how neatly they fit together.  Eurasia has significantly changed in size and shape since the time of Pangaea, so we emphasize how neatly the eastern coast of South America and the western coast fit together, as well as how neatly the east coast of the United States fits with the northwestern coast of Africa. 

Wegener also had a few more clues about how the continents may have been connected.  Students read about the fossils of the pre-dinosaur reptile Mesosaurus and that those fossils were found in both South America and Africa, leading Wegener to hypothesize that these continents must have been connected at one time.  When Mesosaurus roamed the earth, they populated a large region of Pangaea that is now separated onto two continents.

As a meteorologist, he was also interested in climate-related evidence.  Fossils of warm-weather plants have been discovered as far north as the Arctic island of Spitsbergen.  Again, this suggests that islands like Spitsbergen have changed their location and when they were connected to another continent, they were in a warmer climate. 

In order to model this concepts, the students use a large piece of construction paper and cut it into an irregularly shaped "supercontinent" of their own design.  Then the students glue populations of fossils onto the continent.  Finally, students cut their supercontinent into several smaller, irregularly shaped continents.  They were instructed to make sure to cut their continents in such a way that at least a few boundaries cut through the populations of Mesosaurus, Glossopteris, glacial remains and the other fossils provided. 

The following day, I switched up the puzzles and gave each group a mystery supercontinent that was created by another group.  Students had to rebuild the supercontinent based on the same clues that Wegener used - the puzzle-like fit of the continents and the fossil remains of species. 

Below are some images of the students' supercontinents:


The students really enjoyed this project and showed a must stronger grasp of the concepts as a result.  Next time, we tackle the much messier project to demonstrate seafloor spreading!

Tuesday, September 13, 2011

Did You Know?

During my summer of relaxation and recuperation, I found myself flicking through the channels on my old-fashioned tube television - you know, the kind that doesn't have a flat screen, HD reception or a nifty guide for viewing the program schedule.  In my search for something appropriately mindless, I passed over the public media network MiNDtv, known for it's short videos, often submitted by viewers or other sources.

The short film airing at that time was called, "Did You Know?" and it was a simple video that featured facts about Earth's population and growth, as well as many facts about the exponential growth of technology.  The video can be viewed on the MiNDtv website here:

http://mindtv.org/cgi-bin/display_asset.fcg?member_id=1776;ordinal=1182;file=vodind-new.ttml;style=mind

Naturally, there has been a huge emphasis on technology in education recently, but this video forced me to face how important this really is.  The truth is, no matter how memorable certain lessons and experiences were from my own education, some of these approaches are just not practical anymore.  By schooling a child, we should not only be preparing them with the academic skills and knowledge that they will need, but also a steady footing in the technology that is available today. 

My education was not very long ago and we had a full lab of computers with internet access, databases for research and other tools.  But technology has changed significantly since I was in school, and it will change even more in the period between these students' education and their adulthood.  There is no way to prepare them for the technology of tomorrow other than increasing their fluency with the technology of today. 

The original video has been updated several times to reflect new statistical research about the changing world of technology.  The updates are aptly titled 2.0, 3.0 and 4.0.  They are all embedded below.


Wednesday, September 7, 2011

Material Worlds

In the past, I have taught a lesson a few times using pictures from the photo-essay, Material World.  The collection of photographs found families that reflected the statistical average income, family size, and household for each of several selected nations.  The families, who were visibly proud to participate, were asked to sit in front of their home with all of their possessions.  The images are compelling, to say the least.

Not only are the images from India and Mali, among others, surprising to most of my students, the picture of the average family from the United States may have been more so.  Kids in the class are already aware that most families of the world live with fewer belongings and resources than they do, but many truly believe that they are average within the United States.  It was interesting to see their responses to what is truly average in the United States, as well as how much poverty can exist in the world's richest and most powerful country.

Below are some images from the Material World book, documentary and photo essay:

China
The Wu Family of China

India
The Yadev Family of India

Mali
The Natomo Family of Mali

United States
The Skeen Family of the United States

All images are copyrighted to Peter Menzel.  Source: http://www.pbs.org/wgbh/nova/worldbalance/material.html

I was excited to learn that there is a new, similar photo-essay created more recently by James Mollison.  In his pictorial essay, he allows us to see into the lives of children through photographs of where they sleep each night.  Where Children Sleep shows many children from the United States, as well as from several other nations, showing everything from overflowing toy shelves of beauty pageant crowns and dolls to a mattress with scattered blankets next to railroad tracks in Italy. 

Middle schoolers are, perhaps, at the perfect age to begin to see and truly understand the strata between rich and poor both in the United States and around the world.  In the past, we have always had fruitful discussions about these images, and I was excited to hear that there was another more current photo-essay. 

You can see twenty images from Mollison's book on the New York Times "Lens" blog, linked below.

New York Times Lens Blog - Where Children Sleep

Friday, July 8, 2011

Flipped Classrooms

Yesterday, I met with a small group of teachers who are interested in the new and revolutionary notion of "flipped classrooms."  In a flipped classroom lesson, the teacher pre-records lessons, lectures, readings or PowerPoint presentations in video file.  The video file can include the teacher's voice to explain concepts, written notes using the computer's tablet function, or even a webcam image of the teacher speaking and demonstrating.  The student is assigned these videos as a homework assignment so that they come to class prepared with notes and materials.  This way, the time spent in class can be dedicated to live demonstrations, labs, discussions and other active teaching methods. 

There are many ways to attempt classroom flipping, but our school will be using Camtasia Studio to capture the videos, then uploading them to SchoolTube for students to view them. 

Last night, I experimented with Camtasia Studio and created my first instructional video.  It will take some time to get used to the capabilities and quirks of the software, but even in shooting my first video, I could see how this would be an amazing tool. 

My first video concerns one of the most important skills that incoming sixth graders need to know - how to maintain their files on the school's server.  In my twelve minute production, I showed students how to access their folder, how to create folders within the main folder, how to save to the files, as well as some neat tricks like pinning files to the task bar in Windows 7 to speed up their access. 

As soon as I finished that video and uploaded it to SchoolTube, I was already thinking about all the other videos I could make and all the potentialities for these videos.  Slow note-takers can watch videos as slowly and as many times as they need.  Students can easily catch up after an absence.  They can also move quickly through concepts that are easier for them, then spend time on those that are more challenging.  They can even go back and view past videos easily. 

Overall, it will require an initial time investment in the first year to get these ideas and videos off the ground, but in the long run, it will be well worth it!

Sunday, May 15, 2011

Not-So-Simple Machines

For the final unit of the school year, we are exploring the fundamental principles of physics - motion and forces.  We did PowerPoint notes on the six types of simple machines, we explored wheels, pulleys and inclined planes in more detail with the K'Nex competition, and now it was time for a culminating project to wrap-up the unit. 

While brainstorming on what to plan for this project, I remembered an activity that we did when I was in elementary school - we read through old Rube Goldberg comics and created machines.  I immediately knew that this was exactly the silly and creative, yet scientific outlet for the students to show me what they understood about simple machines. 

I started at the official Rube Goldberg website and chose some comics that I thought captured the essence of the idea.  Knowing that this could get boring, I also selected some videos that I thought would capture their imaginations and show that Rube's machines were supposed to be overly-complex, but also silly and entertaining.  I chose an old Honda commercial called "The Cog" and the music video for OK Go's "This Too Shall Pass."
I started presenting the videos to the kids with little or no explanation about why we were watching.  Needless to say, at first the kids were a little antsy and wondering why they were watching "The Cog," but within seconds, they were identifying levers and inclined planes in the machine, and pretty soon, one could hear a pin drop...


Once the videos were finished, I explained to them who Rube Goldberg was and the basic premise of his comics - overly-complex machines designed to complete a simple task.  For the project, the students had to design their own overly-complex machine using at least one of each of the six simple machines.  They were immediately excited and brimming with ideas about what to create, but the period was almost over.  For homework, I had them brainstorm five ideas of simple tasks for which they could design a machine. 


Text-Rendered Poems

How can you assess how much students recall from a book while also analyzing language and composing poetry?  Text-rendered poems are a great way to re-explore past events in a story and analyze words for sound and imagery while creating a written composition.

Text-rendered poems are free-verse poems that use single words and phrases from a piece of text as the lines.  They need not rhyme or follow any structure, only that all words are derived from the text and nothing is added by the writer.  The poet's job is to artistically arrange the lines and words into a cohesive and meaningful poem.

I generally use text-rendered poems towards the middle or end of a piece of literature.  I randomly select two-page spreads from the novel and make copies of them onto separate sheets.  I choose as many pages as there are students in the class.  Students then read through their passage and highlight single words or phrases that speak to them, create mental imagery or describe a key aspect of the story.  Once they have highlighted at least ten words and phrases, they may begin composing their poem.

Each phrase or single word is a separate line in the poem.  The student's job is to arrange these lines in such a way that is pleasing and artistic.  Older students can even arrange their lines with meter or pentameter.  My middle school students arrange the lines with variety of length and will sometimes have a specific goal, such as creating an alliterative sequence. 

After the students have finished their poems, I generally have each student share what they have created.  I am frequently surprised by how fluid and poetic these arrangements sound, and the students are often pleasantly surprised by their creation.  The listeners then raise their hands and try to figure out which part of the story is being described.


As an example to model the process, we read a short story from an old book about a dog who had been stranded at sea on a commercial tanker.  The story describes the rescue effort that ensued, the news coverage of the event, the massive donations from the public to save the dog, and finally his warm welcome to the shores of Hawaii.  We projected the article onto the SmartBoard and selected phrases and words to highlight together.  Then we arranged the phrases into a poem on the whiteboard.  Above are images of the poem that we created based on this short story.  

Thursday, May 12, 2011

K'Nex Competition

The year is winding down and I wanted to get some longterm planning done.  I created a calendar for May and June and filled in each block with the lessons that I would cover each day.  Originally, I planned on doing a few general lessons on simple machines, then dedicating the next six school days to a more detailed study of each simple machine: inclined planes, wheels and axles, wedges, screws, pulleys and levers.  Within a few days, this plan was scrapped.

Once we had explored each of the six simple machines, I didn't think the students could bear an in-depth study of each for the next week.  It was boring and I didn't think that they would retain as much as I had hoped.  Before even beginning with the plan, I decided to hold a mini-competition instead. 

Our science department is fortunate enough to own two giant tubs of K'Nex building materials.  The kits were intended for building a roller coaster, but I wanted something simpler and more focused for our goals.  I broke up our class into two groups and gave each group a task.  One group was responsible for constructing a cart large enough and strong enough for moving the science textbook.  They were given total freedom as far as design because students come with so much background knowledge already about carts, cars and wheels. 

The second group was responsible for constructing a pulley strong enough to lift two metal weights.  I showed the weights to the group so that they were fully aware of the load that their pulley had to carry.  I also gave them a booklet that came from with the K'Nex kit about constructing pulleys.  They were allowed to use the photos in the booklet for reference, but their pulley did not have to follow the directions exactly.  The weight that they had to lift was significantly larger than the weight featured in the photo, so they had to adapt their creation to accommodate more weight.  I was pleased to see that none of the groups copied the model exactly and that they all added features that they thought would increase the machine's efficiency.

The two groups constructed their pieces simultaneously, then we tested the pieces and kept lab data about how much force was needed to pull the loads.  We used a spring scale to measure how much force was required to move the textbook without any machine, then we measured how much force was required to move the textbook with the help of the cart.  In most cases, the students constructed carts that were provided significant mechanical advantage. 

We used the spring scale again to measure how much force was needed to lift the weights with no assistance, then we used the spring scale to measure how much force was needed to pull the rope through the pulley.  Most of the pulleys had only marginal mechanical advantage, but I explained how adding more pulleys can increase the advantage and decrease the amount of effort. 

Once our machines had been tested and we recorded the data into the lab sheets, we disassembled the machines and switched roles.  The cart team was now responsible for constructing a pulley, and the pulley team for a cart.  The new machines were tested and compared to the first round of machines.

Within the parameters that I described, the students, for the most part, worked cooperatively and built machines that met or exceeded my expectations.  Rather than spending two days teaching wheels and axles and pulleys to the students, they experienced the concepts hands-on.


Monday, May 2, 2011

For every action...

...there is an equal and opposite reaction, and for every active lesson, there will be an equal and positive student reaction! 

When teaching Newton's Three Laws of Motion to my sixth graders, it is absolutely essential that we model each principle.  Shortly after seeing these forces in action, students start to realize that much of Newton's philosophy was based on common sense from real-life experiences. 

For Newton's third law, we used several examples to model how forces act in pairs and how these active and reactive forces cause motion. 

After completing quick notes to keep in our science binders, we watched videos and analyzed how these motions from the students' shared experience and knowledge showed Newton's third law in action. 

Our first demonstration was to simply inflate a balloon, then release it and let it zip around the room.  I explained how the contracting sides of the balloon forced out air.  The reactive force propelled the balloon forward, causing it to fly around the room.

Before the lesson, I did a quick search on YouTube and bookmarked some videos of similar active and reactive forces.  I chose to show a jellyfish and a rocket.  After watching the videos and briefing the students on the forces in them, the students recorded their observations in their notes for later reference. 


The culminating activity of this lesson is a lab demonstration.  For the lab, we borrowed scooters from the Physical Education department.  We used masking tape to mark off starting lines for the two scooters, then we demonstrated how force applied from one scooter causes both scooters to move.  The lab is explained in more detail on the lab sheets below. 


This lesson was a success in our classroom, both in terms of student engagement and student understanding.  It helps, however, to have a little extra help with overseeing the students while they setup and demonstrate the scooter portion of the activity!


Calculating Speed - Time Trials

During our unit on Motion, we had to apply the formula for calculating speed.  We did some practice worksheets with this concept, but I wanted to use a more active, kinesthetic approach, as well. 

I decided to take the students out into the hallway and do some time trials.  I didn't want, however, the kids to be racing and comparing times for running.  I was worried that it would either turn into chaos, be hurtful to students with slower times, or both.  They already have fitness testing to make them aware of who can run the fastest, so I decided to something a little sillier...

In the hallway, we created a "racetrack," which was really a measured track with a starting line and a finish line marked on the floor with masking tape.  The start and finish lines were 30 feet apart.

Each student was assigned some movement, and they were allowed to volunteer for each movement so that no one was forced out of their comfort zone.  We had "safe" movements, like walking, running and jogging, for students who were a little more self-conscious, then we had skipping, army crawl, log roll and crabwalking for the more adventurous students.  After each student was assigned a task, we began our trials.

I sat at the finish line with a stop watch and calculated how long it took for each student to go the 30 feet.  We kept chart of the times on a piece of large chart paper that was taped to the wall.  After a few trials, students began to correlate that faster movements took less time.

Finally, we brought the chart paper back into the classroom and each student was responsible for calculating his or her speed in feet per second.  We then charted these results on another sheet of chart paper.  As a final culminating assignment, the students graphed the comparative speeds of each activity onto graphs that they kept in their notebooks. 

It is innately apparent to a middle schooler that running will be faster than a log roll, however, these calculations and graphs gave scientific and quantitative context for that tacit understanding.  The students enjoyed this activity and, best of all, it was appropriate and comfortable for all of the different personalities and sensitivities of the class.