Wednesday, November 16, 2011

Natural Selection Monsters

Even though natural selection is one of the most important concepts covered in sixth grade, it is one of the hardest for the kids to conceptualize and understand.   After we read and instruct about the process, we model the process in action by creating fictional monsters with favorable and unfavorable traits and playing a game to see how they fare at survival.

To create the monsters, we used Me Make Monster, a website that allows you to customize and name a monster, then purchase gifts with the image printed on them.  Students are placed into partner groups to experiment with the website and create two monsters, a male and a female, that are mostly similar with some favorable and unfavorable variations. 

Some of the students' monster creations are shown below:

The images of the monsters are printed, then placed on a family tree-style diagram poster.  The students fill in a chart explaining the various traits of the two parents and determining whether the traits are favorable or unfavorable.  The family tree poster is shown below:


Once the two parent monsters have been created and defined, the students roll a die to determine the traits of the offspring.  For each trait, for example, hair type, the students will roll the die to determine if the individual offspring will get the mother's trait by rolling an even number or the father's trait by rolling an odd number.  As this process is repeated, the parents should produce four unique offspring.

For each offspring, the students then analyzed their traits and determined how many were favorable and unfavorable.  They then followed the directions for a new game using the die again that would decide the fate of each individual - survival or death.  The more favorable traits an individual had, the more likely it was to survive in the game. 

One of the main points that we tried to deliver when discussing natural selection is that it is more about tendencies and likelihood than it is about guarantees, and that is why evolution is such a slow process.  In the game, as in life, it is possible for a very well-suited organism not to survive, just as a very unsuited organism can survive. 

Friday, October 28, 2011

Fossil Records

We have moved on from plate tectonics, earthquakes and volcanoes and it is now time to move on to Life Over Time.  Over the next few weeks, we will explore how life developed on Earth, how it changed over time, and the theory of natural selection.  The very first section covers fossil evidence of earlier species.

There are three basic types of fossils that can be discovered:  parts of an organism, whole preserved organisms, or traces, molds and casts of organisms.  It is much more rare to uncover a whole organism or a part of an organism.  To demonstrate this point, we made a fossil record of our own lives and played a little guessing game to determine whose fossils we studied. 


It is worth noting that we took a few liberties here with our interpretation of "fossils."  The students selected five small objects that represented different stages in their lives - baby, toddler, early childhood, upper elementary grades, and middle school.  We made sure to discuss, however, that fossils are remains of living organisms, not objects.  Either way, students made fossils from air-dry clay of their objects then "buried" them in order of when they occurred.  The oldest fossils would be found below the newer ones.

Because I teach three sections of sixth grade science, it was easy to scramble up the samples the following day.  Each student in the class received the fossil record of another student in another homeroom.  They filled in a chart with their best hypotheses about what the imprints showed, what they represented and what they were able to learn about the person.  Finally, they made a guess about who they thought the created that record.  We revealed the guesses and made it into a fun game at the end of the second day of the lab.  

Wednesday, October 12, 2011

Explosive Volcanoes!

We are all familiar with the baking soda and vinegar model of a volcano, but only a science teacher would fixate on how little this instructs about how a volcano actually works.  Sure, it looks cool, but volcanoes really have nothing to do with some kind of substance pouring down, creating a chemical reaction and fizzing out of the top. 

Instead, we decided to model volcanoes in a more accurate, albeit messier way.  When we studied volcanoes, we focused primarily on the types of sites where volcanoes occur (convergent plate boundaries, divergent plate boundaries and above hot spots), as well as the basic parts of a volcano.  The magma/lava, afterall, comes from below the surface and as it cools on Earth's surface, new rock is created, not just a fizzy mess of baking soda and vinegar. 

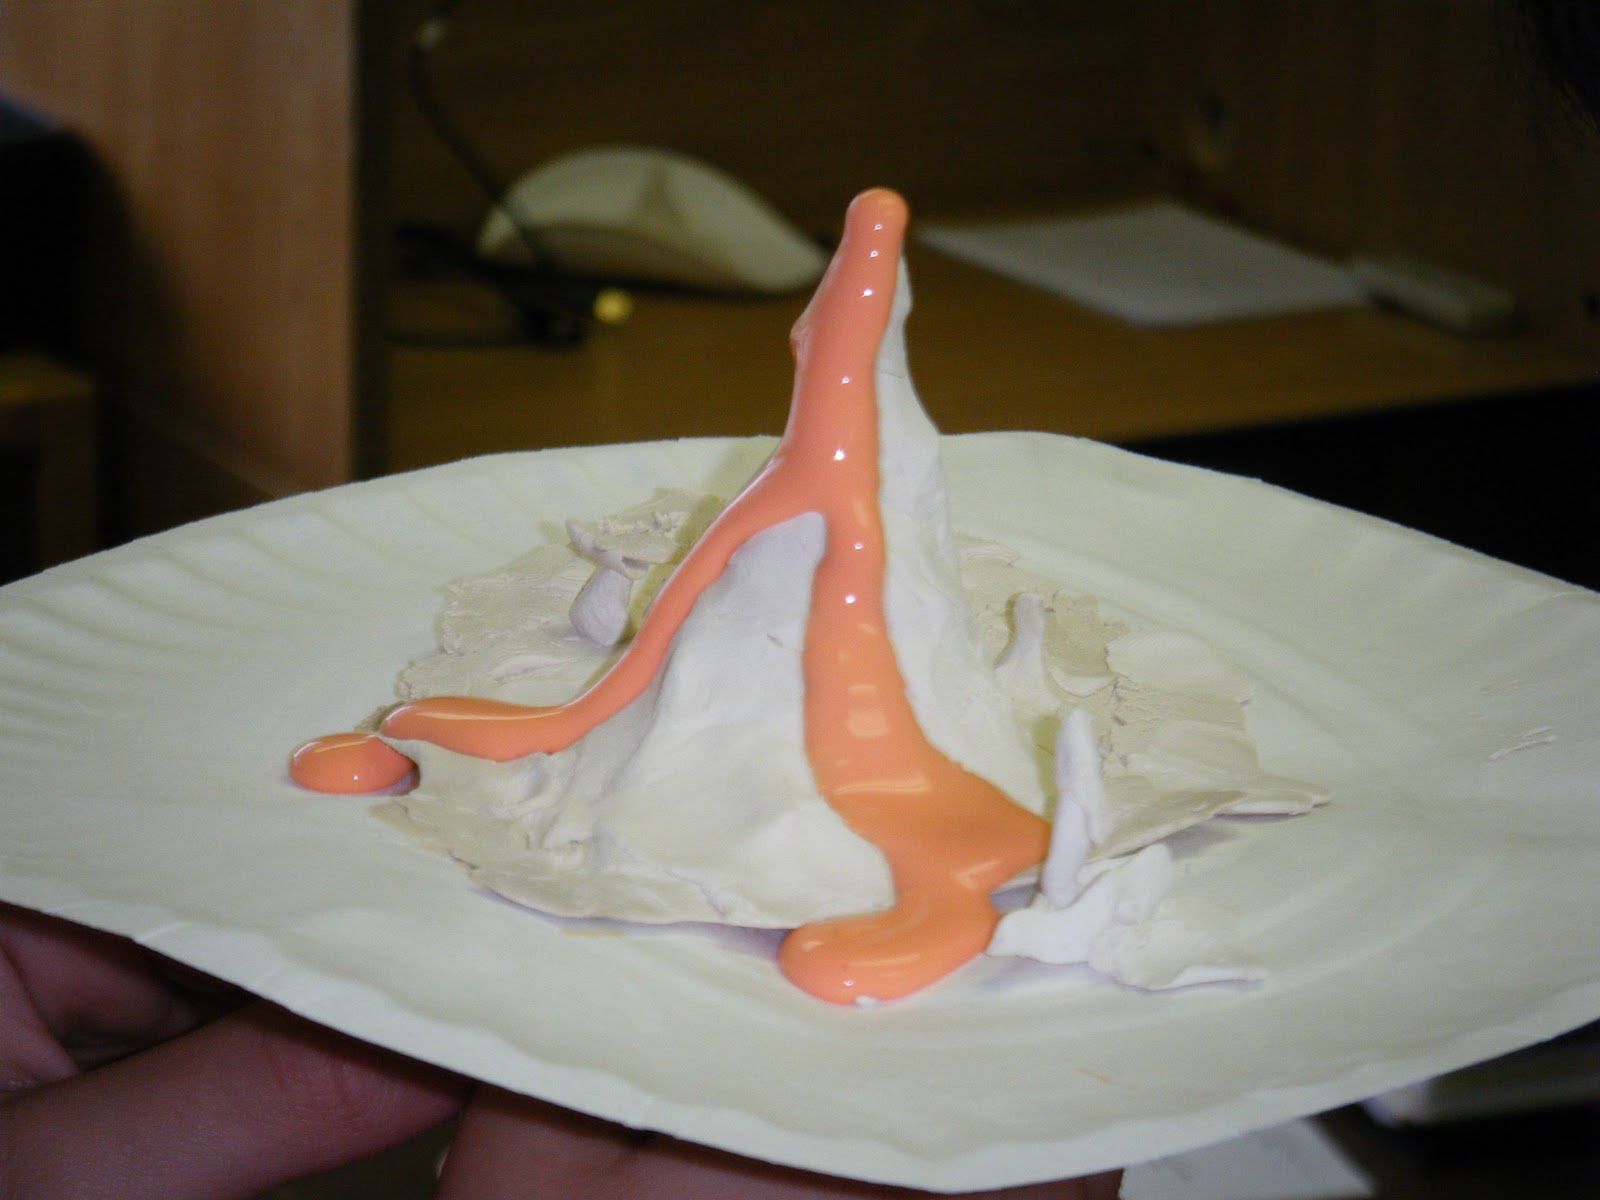
Our volcanoes were constructed out of clay.  We constructed the mounds around a straw that had been poked through a paper plate and secured in place on both sides with rubber bands.  The paper plate will represent Earth's surface, the clay represents the volcano mound and the straw will become the main pipe of this cinder cone-like volcano.  Make sure that several inches of straw are exposed on the top of the plate and at least one inch below the plate.  We constructed the volcano/straw structure on the first day of the lab, then let them dry over the weekend.


When we returned on Monday, the eruptions could begin.  We created our own mock magma the same way we had for our seafloor spreading demonstration - white school glue mixed with red and yellow food dye.  Carefully using a funnel, we filled a balloon with the magma, thus representing the magma chamber below the surface.  Make sure not to overfill the balloon or it will be impossible to attach to the model.  Only fill the round part of the balloon, not the neck. 

We washed the funnels out right away to make sure that the glue did not dry, creating a permanently glued mess.  Once the funnels were washed and the balloons filled, we carefully rubber-banded the balloons to the exposed inch of straw under the plate.  It is nearly impossible to make the rubber band tight enough by wrapping it around, so I suggest using a slip or loop knot tightly around the straw.

One partner should hold the knotted rubber band and the base of the balloon around the straw while the other partner gently pumps the balloon.  The magma should flow freely out of the straw.  On their lab sheets, I asked students to reflect on where and how the lava flowed depending on the slope and roughness of the mound's surface.  They also noted that as the lava "cooled" (really it was drying), it slowed down in its flow and began to pool up in low-lying areas. 


Whenever setting these models down, we always placed them on two desks with the bottom's balloon and exposed straw poking in between the crack of the desks.  In order for the models to dry overnight, we make stacks of textbooks with cracks in between so that they could sit flat to dry.  Once all of the glue was dry, I cut the balloons and excess straw off the bottom with scissors so that the models could now sit flat for further analysis for their lab sheets. 


This was a fun way to model how volcanoes work that was a little more accurate than the old vinegar and baking soda model.  While there were plenty of opportunities for huge messes during this lab, most students genuinely wanted their model to be successful and carefully followed the directions to do so.  Once students analyzed the eruption, filled in their sheets identifying each part of the model and what it represented, and read the accompanying text, I felt that they had a far better understanding of a volcano than from the baking soda model.

Wednesday, October 5, 2011

Modeling a Seismograph

While reading through our text and completing our notes, we read about how seismographs measure the intensity of earthquakes, but there is no better way to explain it than to see one in action.

Last year, I came across a deeply-discounted model of a seismograph in one of the science supply catalogs, so we bought it.  The model is a very basic one, just a roll of paper with a stand and a mounted felt-tip pen that moves freely in response to movement. 

In class, we used styrofoam blocks cut at an angle to represent tectonic plates meeting at a fault.  We sat down around a wobbly table and created some quakes with our "plates."  Luckily for us, our classroom table is already pretty wobbly, so it didn't need much help!

We modeled earthquakes at three types of faults - normal faults, reverse faults and strike-slip faults.  The seismograph measured the intensity of each. 

Below are some images of our "quakes" in action:


Even though our styrofoam blocks made quite a mess of foam dust, it was worth it to see the students really understand how seismographs work and to let them take a break from normal classroom routines and shake things up a little!

Wednesday, September 28, 2011

A Teachable Earthquake

When something unexpected occurs, either in the classroom or in the world, and it provides an opportunity to teach outside of the curriculum, educators refer to this as a "teachable moment."  The East Coast Earthquake of 2011, centered in Virginia, is an example of a "teachable" event that actually fits conveniently into our curriculum for sixth grade.

After our study of plate tectonics, we have moved on to look more closely at the catastrophic byproducts of plate movement - earthquakes and volcanoes.  As we studied earthquakes, however, the earthquake that we all experienced just a few weeks ago has become a meaningful piece of experience that the kids all share with the concepts covered in class.


Once we had explained the causes of earthquakes, as well as the concepts of the focus and epicenters of quakes, we were able to examine the USGS maps of the 2011 East Coast Earthquake.  Since several of our students were on vacation in several different spots along the east coast, we were able to plot their locations and their experience based on the epicenter and magnitude diagram shown below. 


Most of our students knew several facts and had lots of questions about the earthquake based on the news coverage from that day.  To further explore their memory of the quake, we watched news footage of the breaking story.  The video below includes security camera footage of the shaking at the White House. 


Overall, the kids could much more easily relate to the feeling of a quake given that they had just experienced a historic one just a few weeks ago.  

Tuesday, September 20, 2011

Convection Currents

So far, we have examined Earth's plates and how they move, as well as what occurs at convergent, divergent and transform boundaries.  But why are the plates moving?

Tectonic plates are floating above a plastic-like layer of magma material in the mantle.  The intense heat in this layer causes convection currents.  Convection currents are circular patterns of heat in liquids and gases.  Generally, hotter material is less dense and cooler material is more dense.  As material nearest to the outer core is heated, it becomes less dense and moves upward above the cooler material above.  As it moves closer to the crust, however, it cools, becomes more dense and begins to sink again, creating a circular current of heat movement.  Depending on the direction of these currents, the plates slowly move together, apart, or past each other. 

The phenomenon is visible in heated water, as well.  It happens much more quickly, of course, but it makes for a good demonstration in class. 

For this lab, we place beakers of water onto a lab burner.  I usually place a few beakers on each burner so that the demonstration can be attempted a different temperatures or multiple times.  As the water heats, students answer discussion questions on their lab sheet including, "which part of the beaker is the hottest?" and "which part of the mantle is hottest?"

As the water heats, add a drop or two of food dye into the water.  The students must watch closely because the dye will become completely mixed into the water very quickly, especially if the water is already very hot.  On their lab sheets, they should draw as accurate of a sketch as possible to show the circular currents of food dye in the water.  Once the dye becomes completely mixed, the convection currents are still occurring, it is just no longer visible. 

Below are some images of the circular currents in action:


Friday, September 16, 2011

Spreading the Word about Seafloor Spreading

Inevitably, as soon as we finish explaining how the continents could have drifted apart, the questions start rolling in about how this could have happened.  Luckily, the next section in our notes and our next "lab" answers just that question!

The process of seafloor spreading is what causes the continents to slowly drift apart.  Running down the middle of the ocean is a mid-ocean ridge - a crack between two tectonic plates.  At the mid-ocean ridge, the fiery hot convection currents of magma below the crust exert intense pressure and push the two plates slightly apart.  The magma oozes into the crack that is created and creates new seafloor and the ocean becomes gradually wider, forcing the two continents apart. 

On the opposite end of the plate, the pressure collides the plate with another plate.  Generally, these plates converge and one dips below the other.  As it delves deeper into the mantle, it is heated and melts back into magma, thus continuing the cycle.

In order to model this phenomenon, we created a simple model out of construction paper, glue and masking tape.  I prepared ahead of time by cutting out brown construction paper to model the tectonic plates.  I cut 9" x 12" paper into 4" x 4" squares.  Each group will need four of these squares.  For each group, take two of the squares and tape them together with masking tape end to end.  The other two will stay separate. 

We created mock magma by combining white school glue with red and yellow food dye and mixing it with a popsicle stick in a small paper cup.  The students then spread the magma in a thick stripe down the middle of the large sheet of white paper.  We placed the taped together plates and the loose plates over the strip of magma touching end to end with the intersection over the strip.  At the far ends of the brown paper, we taped them loosely to the white sheet just to hold them in place.  Finally, we were ready to model the process. 

The students slowly slide the plates apart over the magma and watch as the magma rushes in to fill the crack.  As the magma cools, new seafloor is formed and the ocean is wider.  On the other side of the plates, they meet another plate and the intersection either rises like a ridge or mountain range, or it dips below another plate.  Both of these possible outcomes are shown on the model. 

I provided the students with a sheet of labels to apply to their diagram.  They simply cut out the labels and applied them where they belong.  Below are some images of the works in progress, and a completed sample: